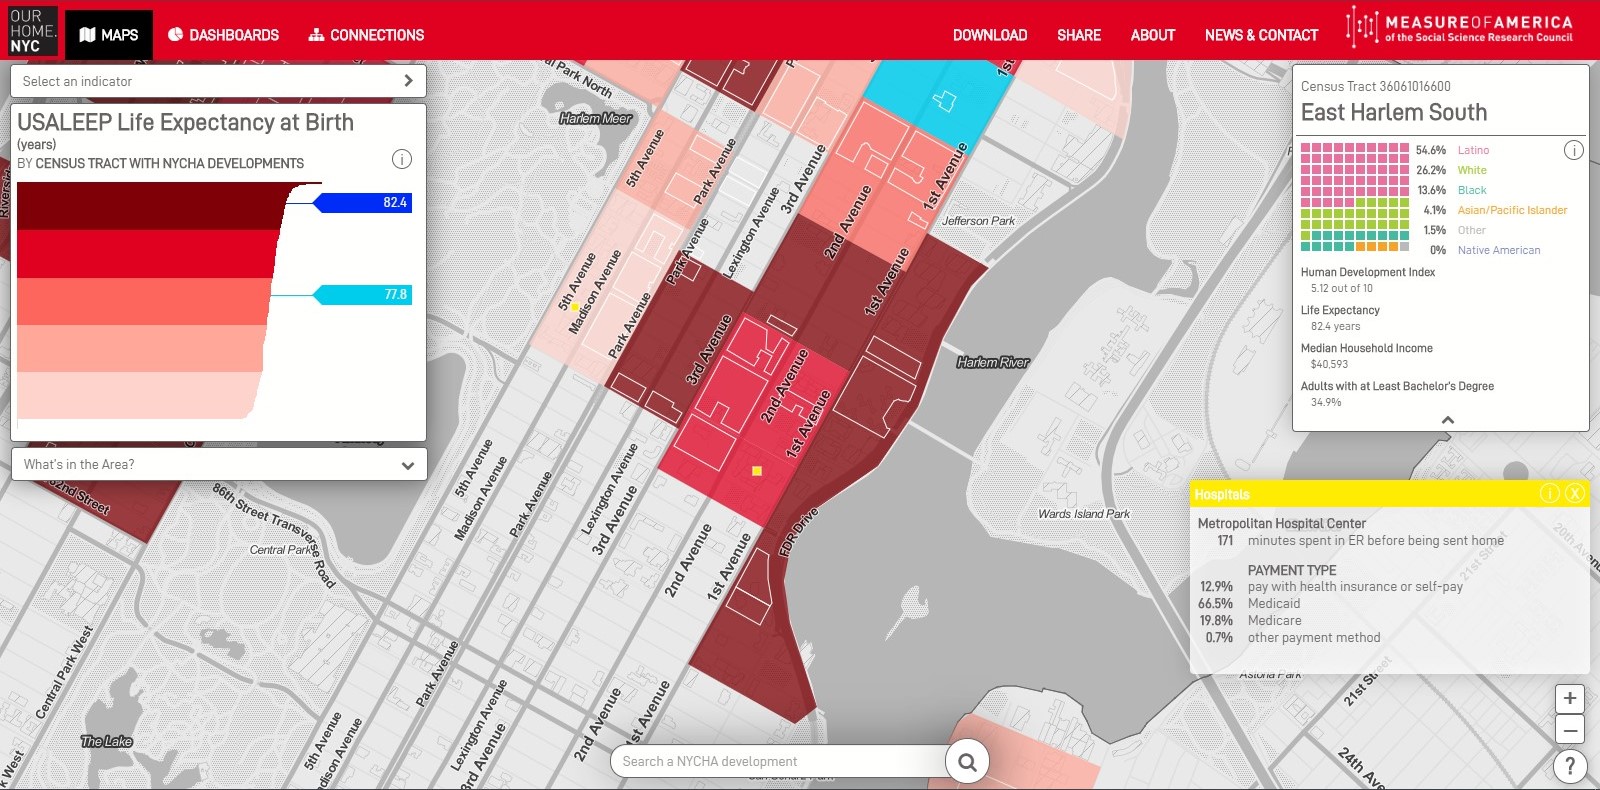
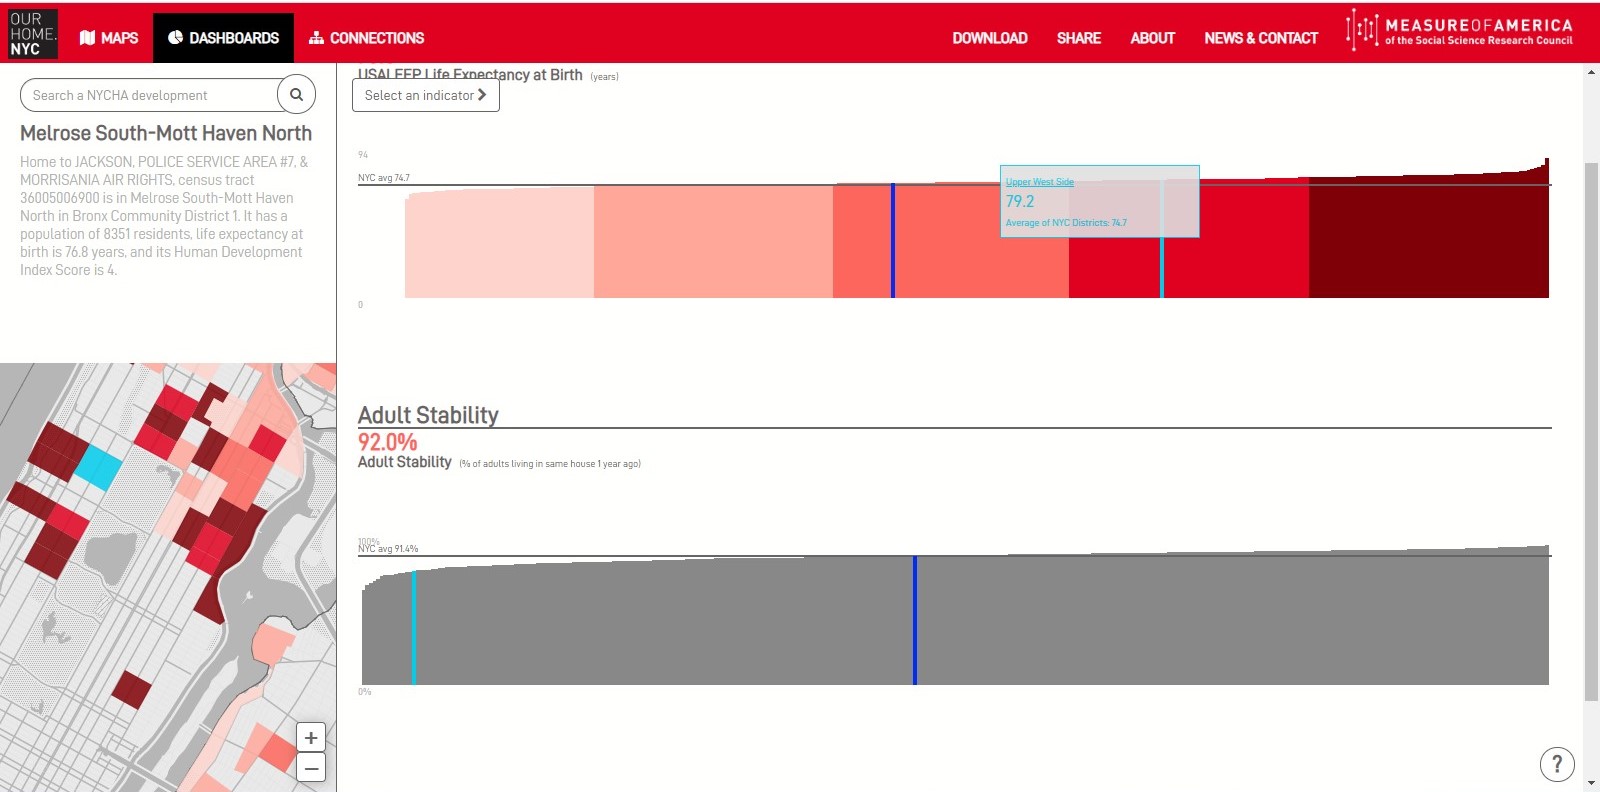
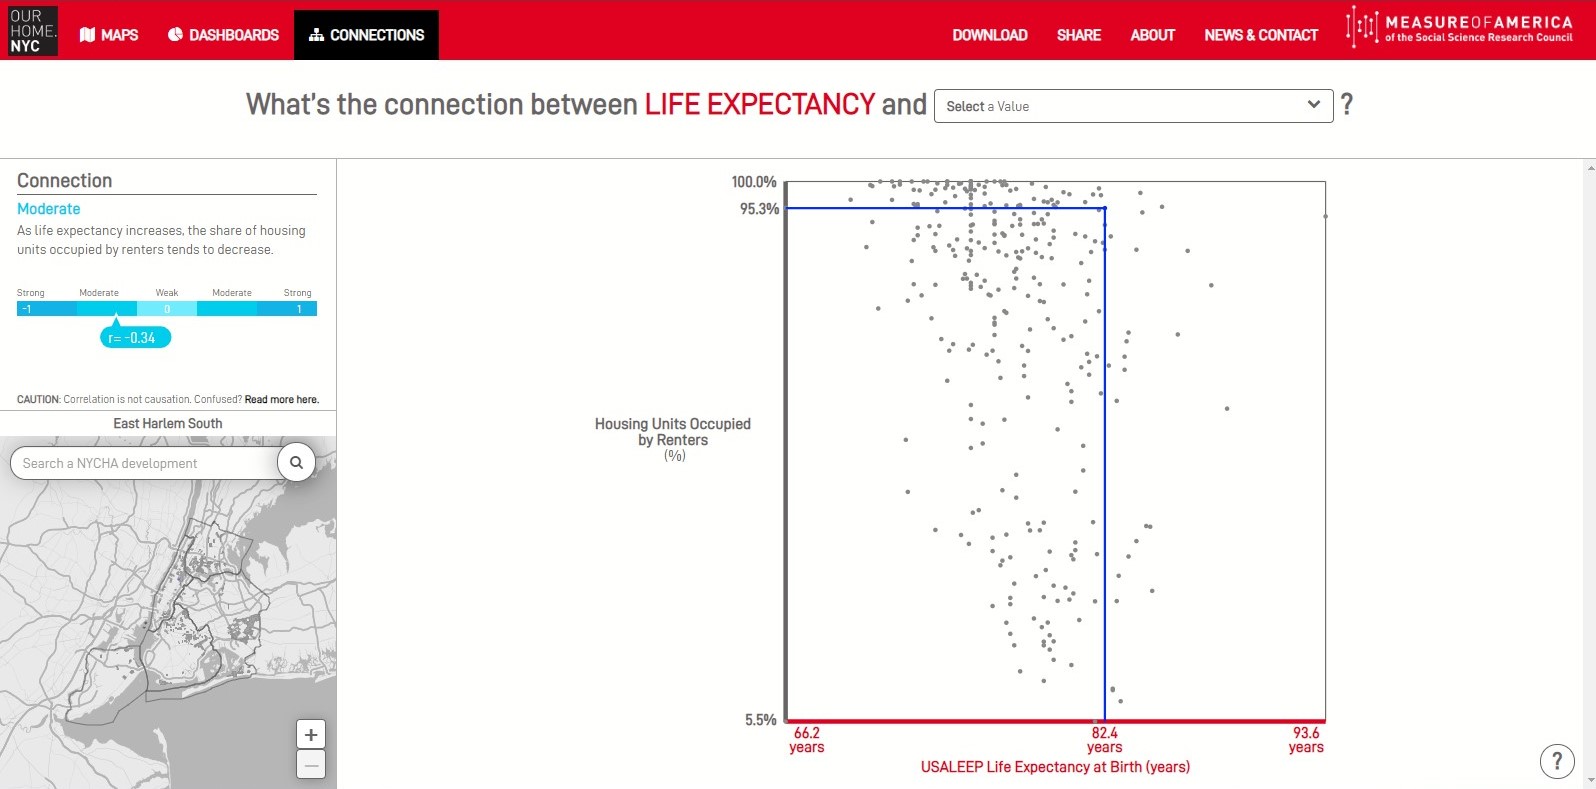
Project Background: The Our Home NYC application focuses on the relationships between health-related indicators for the City of New York. Explore the data over three views; Maps, Dashboards, and Connections.
My Role: Application development and coding.
Public Link: https://ourhome.nyc/
Stack: HTML, .css, .js (leaflet.js, d3.js, jQuery)
Features:

Maps view – An interactive choropleth map, demographic sidebar and histogram adaptable to a variety of indicators. Also, use Our Home NYC to search for features of interest, geographical units, and indicators with type-ahead suggestions.

Dashboards view – An interactive and configurable dashboard of modules.

Connections view – An interactive and configurable map and scatter-plot for exploring correlation between two indicators.

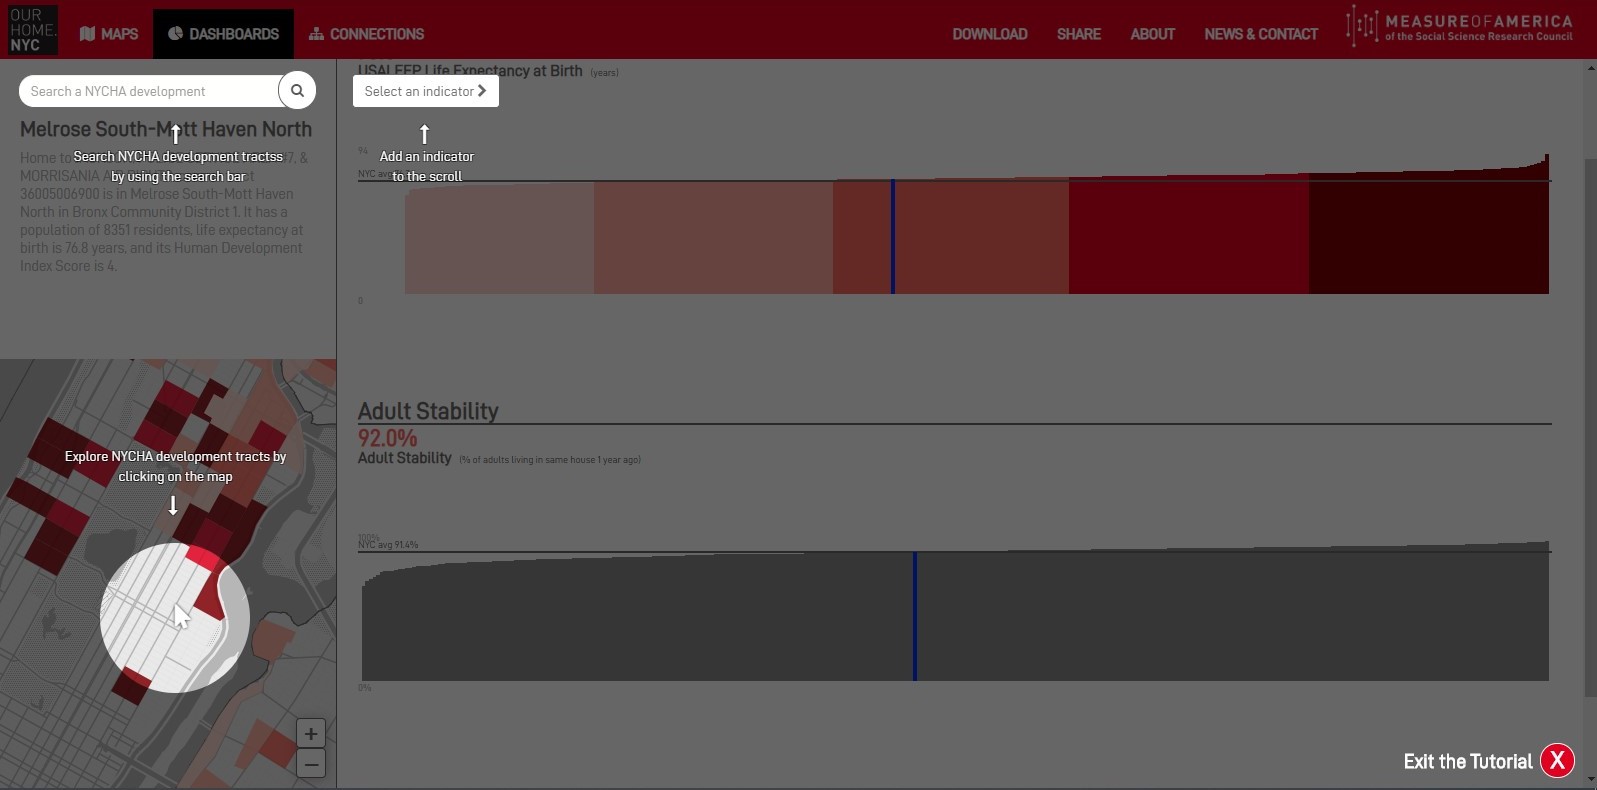
Integrated tutorials – Tutorial directives plotted on top of interface for quick overview of functionality.
