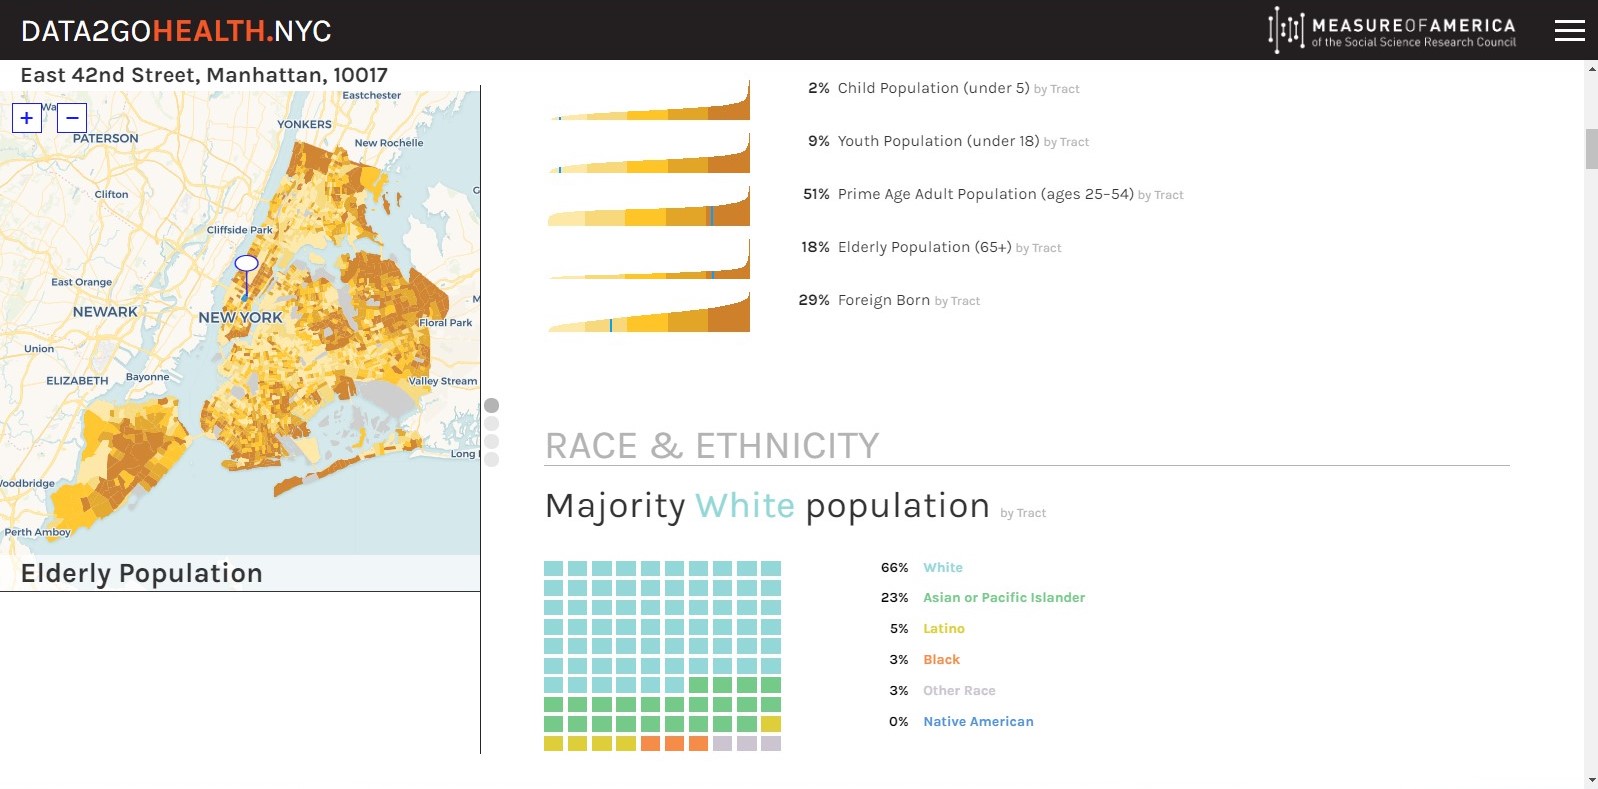
Project Background: data2GoHealth.nyc brings together federal, state, and city data related to health. The application presents over 300 indicators joined across seven different geographical units focused around the City of New York.
Public Link: https://data2gohealth.nyc/
Stack: HTML, .css, .js (leaflet.js, d3.js, jQuery)
Features:
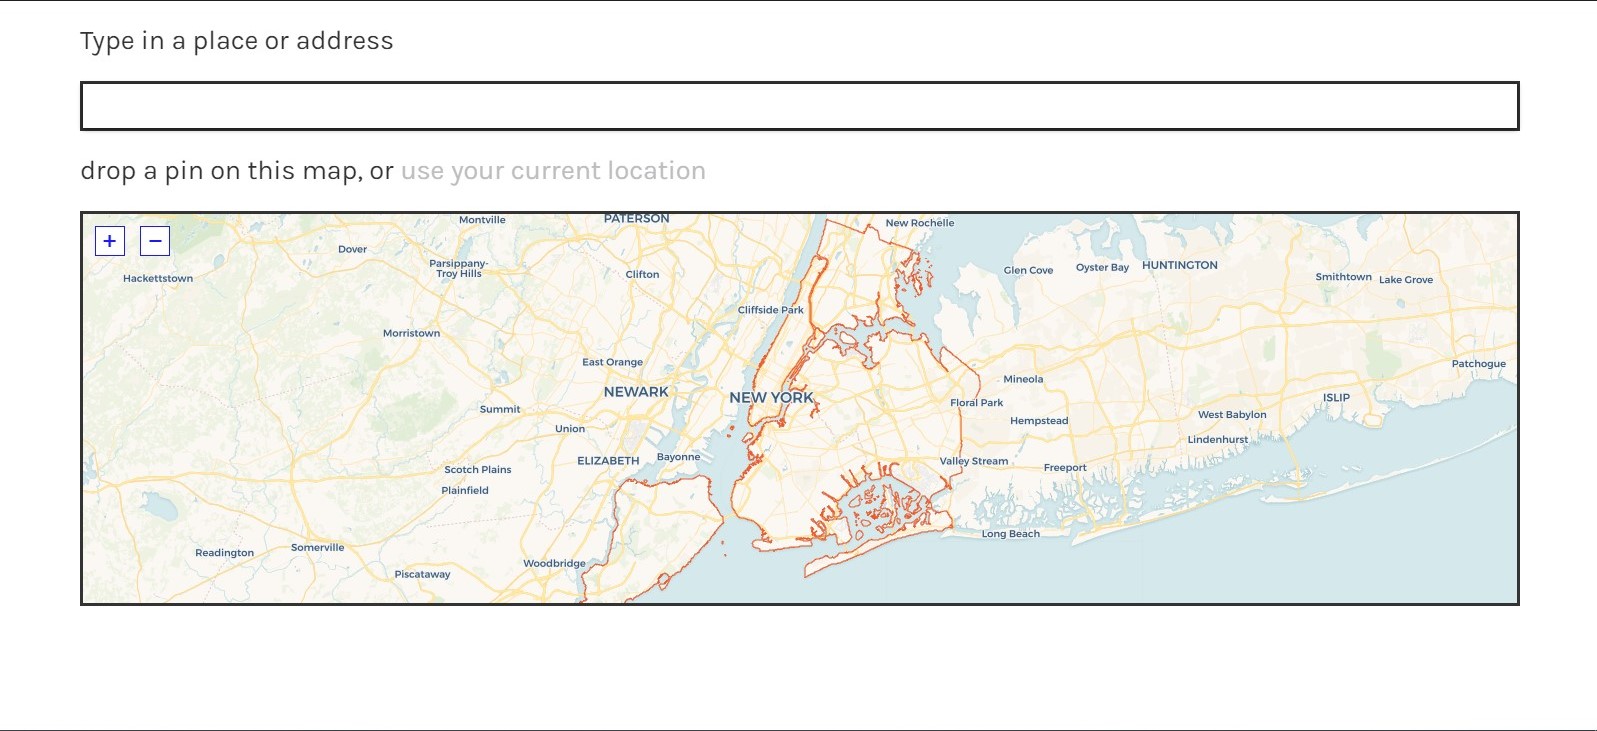
Main view – Select area to explore via geocode or reverse-geocode.
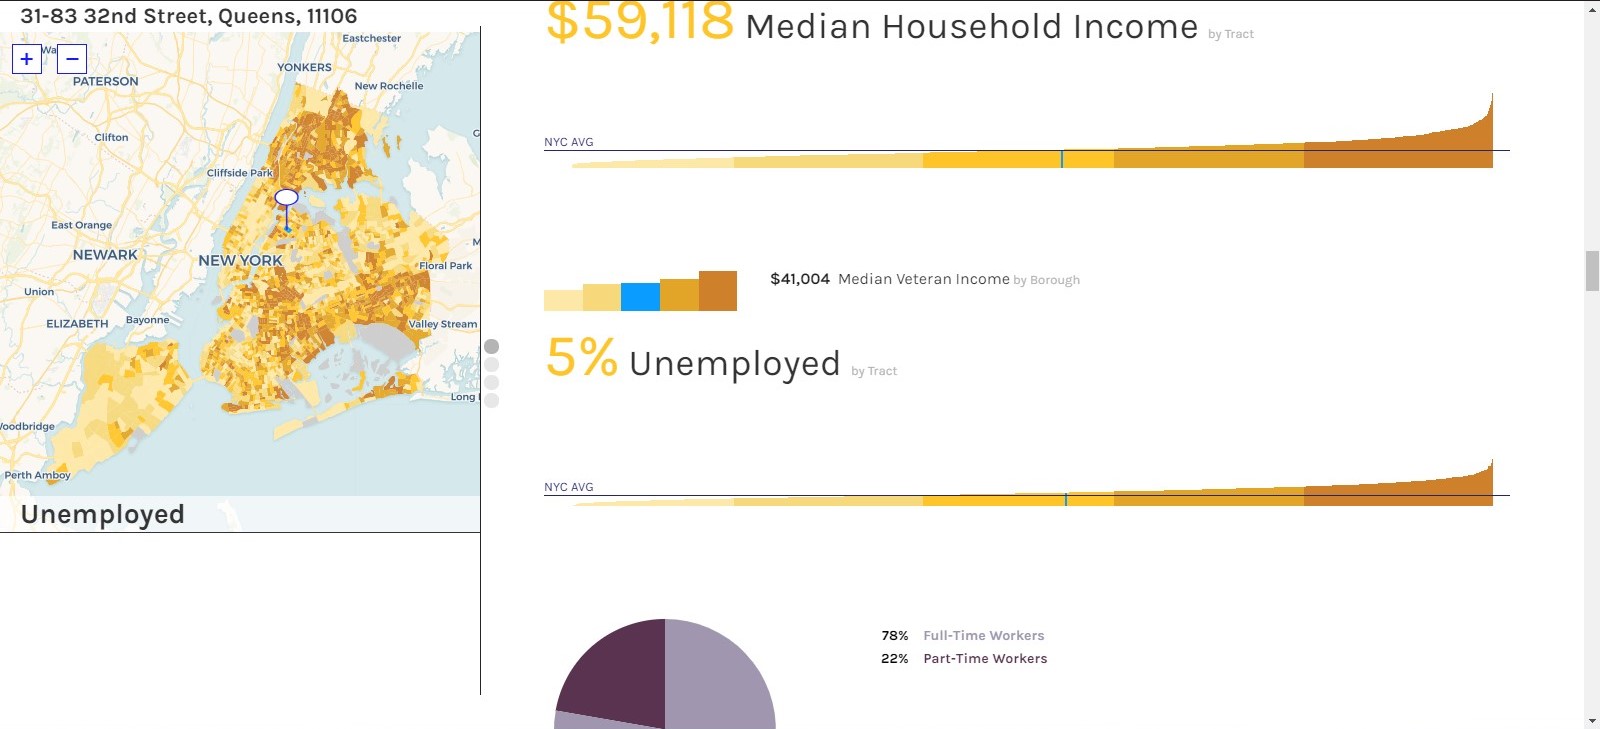
Scroll – Scroll through stats in sector of interest with location highlighted. Choropleth map correlates to each chart.
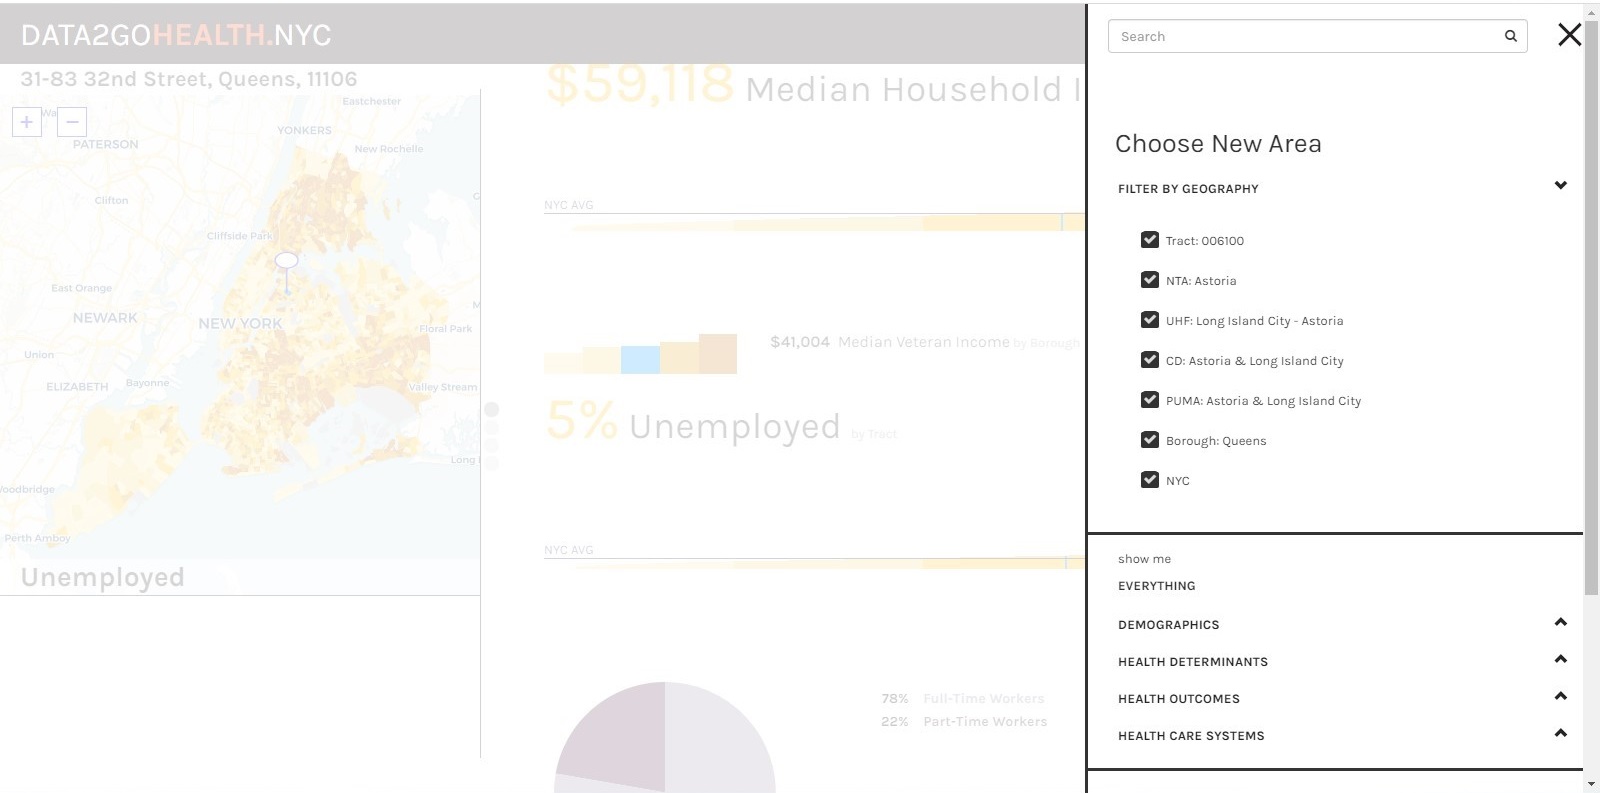
Filter Charts – Examine the indicators and geographies of interest using a variety of filters.
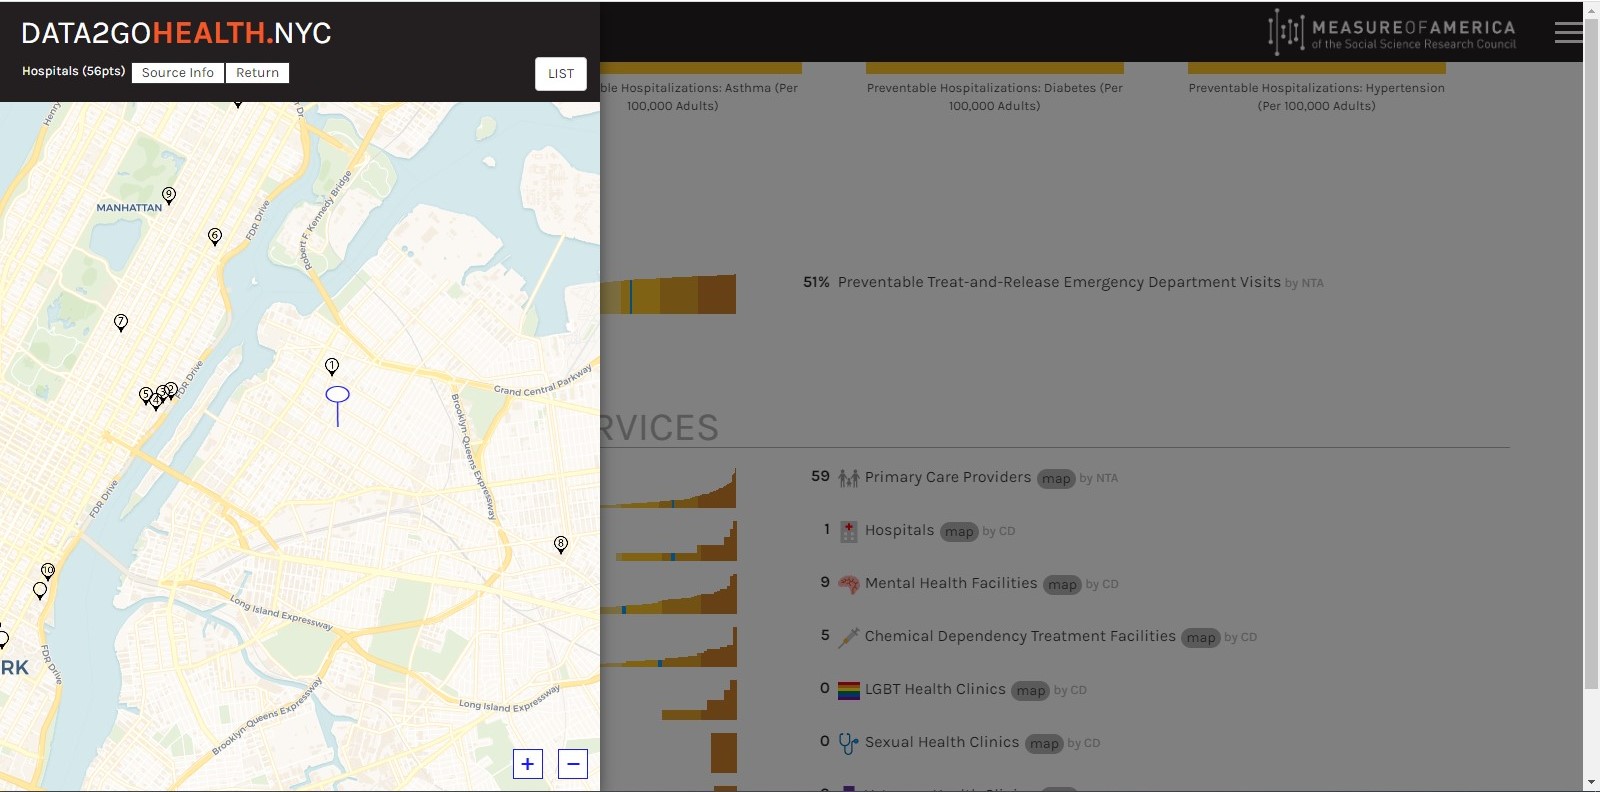
Nested Feature Maps – Dive-deeper with nested maps displaying related features of interest.
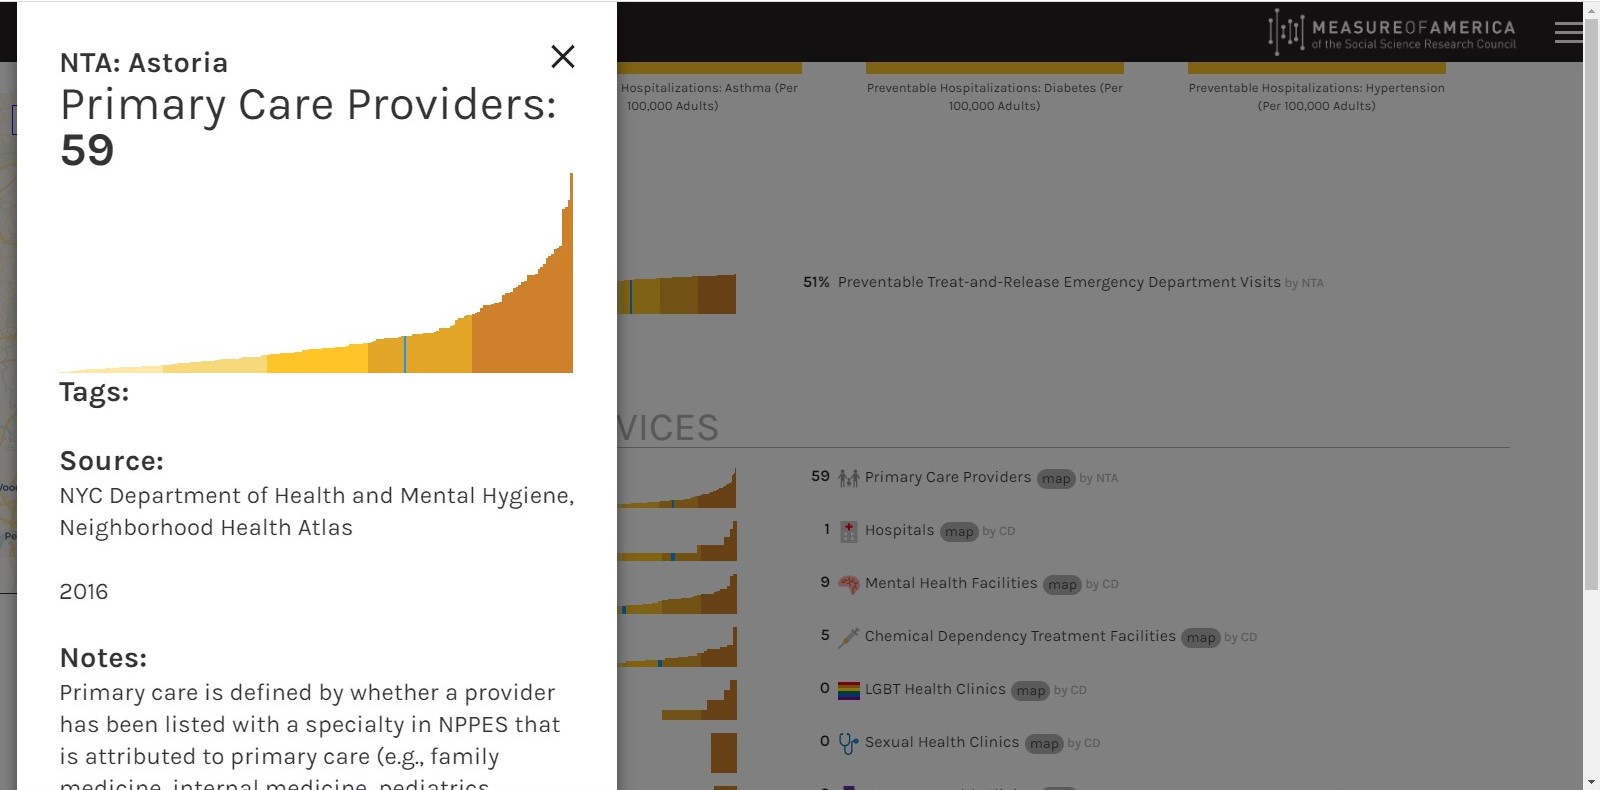
Histogram Detail – Histogram and metadata for each participating indicator.
