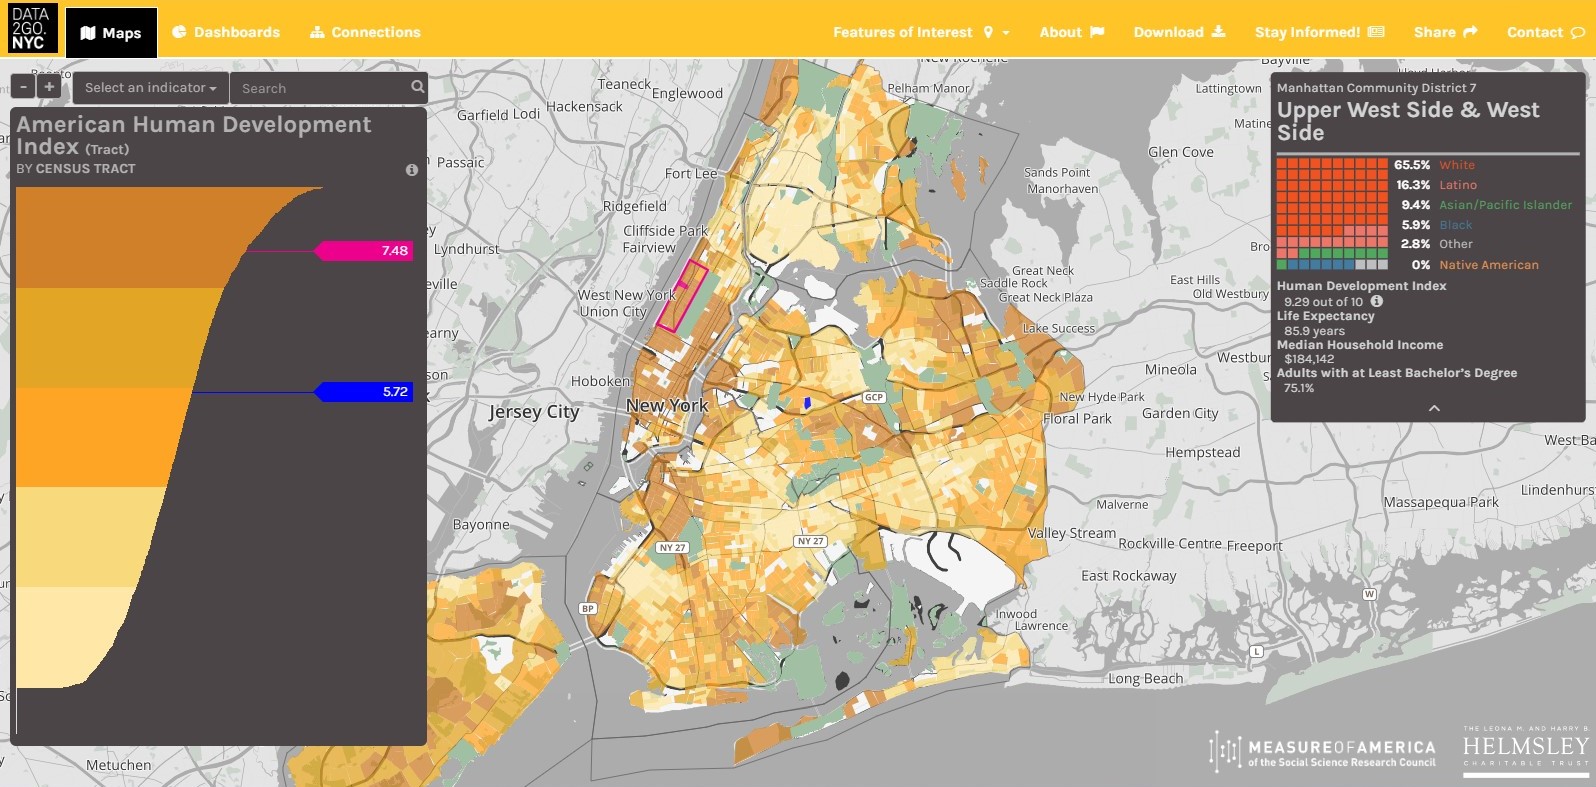
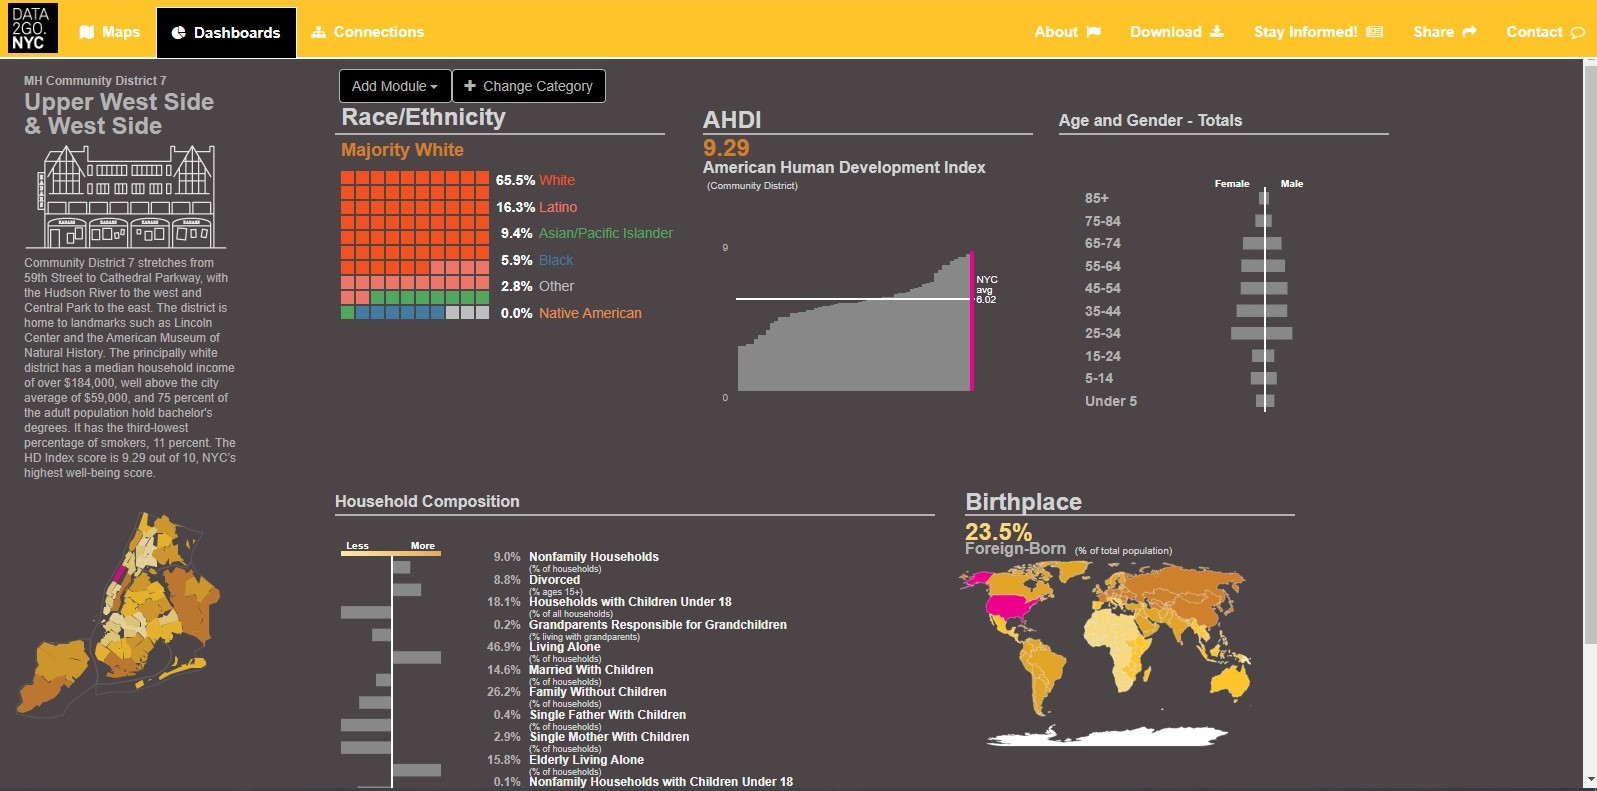
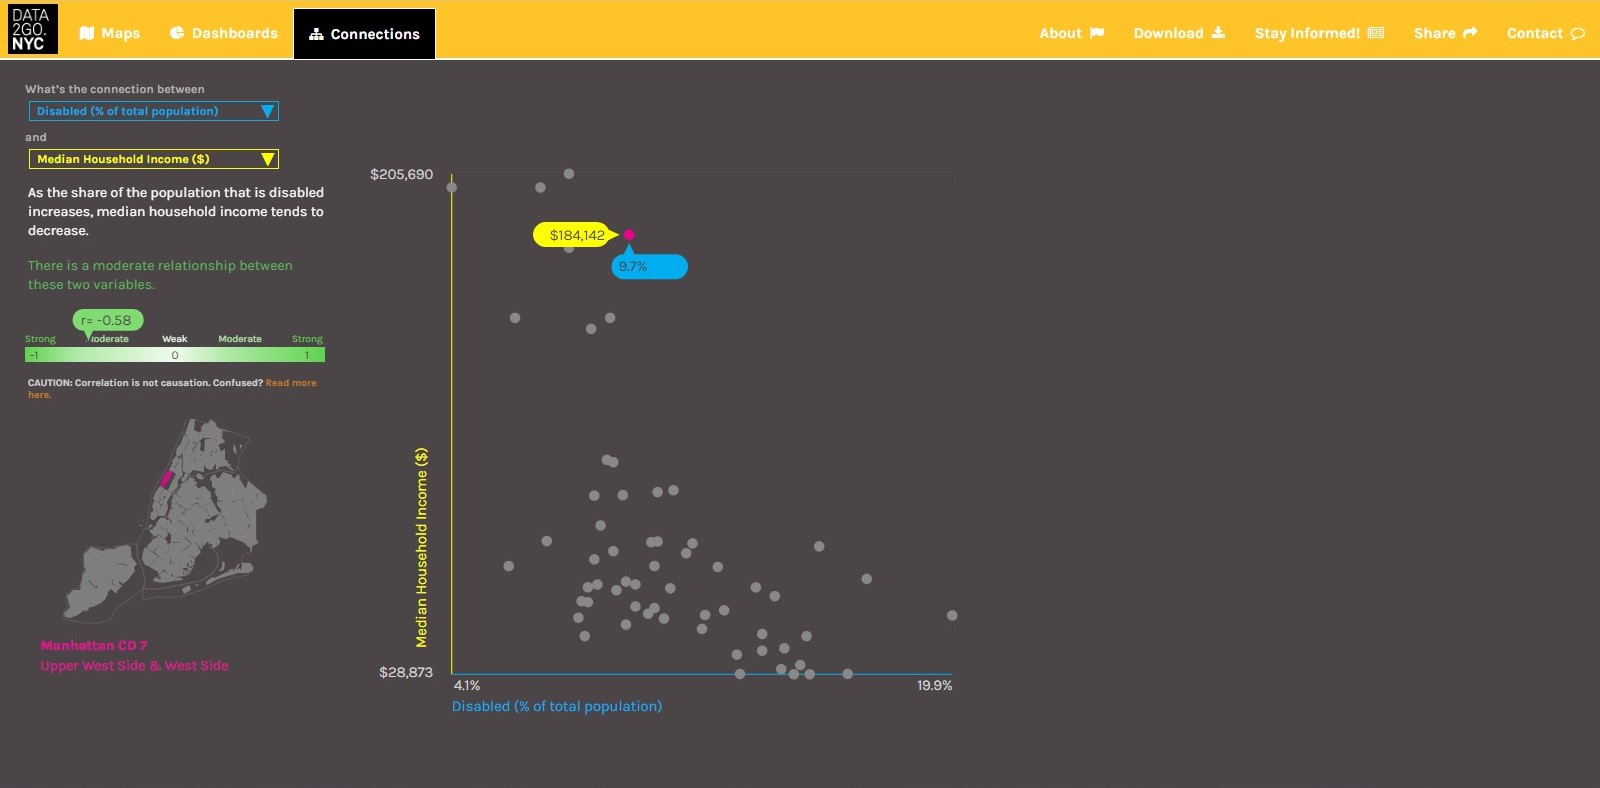
Project Background: With over 100 indicators, this program allows users to explore a broad and unique variety of New York City data federated into a single app. Users can explore data across three separate views; Maps, Dashboards, and Connections to compare indicators joined-to 2,166 of NYC’s Census Tracts and 59 Public Use Microdata Areas.
My Role: Application development and coding.
Public Link: data2go.nyc
Stack: HTML, .css, .js (leaflet.js, d3.js, jQuery)
Features:

Maps view – An interactive choropleth map, demographic sidebar and histogram adaptable to a selection of more than 100 indicators.

Dashboards view -An interactive and configurable dashboard of modules.

Connections view – An interactive and configurable map and scatter-plot for exploring correlation between two indicators.
